
Interest Rates Matter – A Lot
Virtually all valuation methodologies include interest rates somewhere in the equation or model. Real estate capitalization rates, dividend discount models and bond valuation models are just a few examples.
To see the potential impact of interest rates on real estate values, I took a look at how house payments change with changing levels of interest rates.
“According to the National Association of Realtors (NAR), the median U.S. existing house price for all home types (single-family, townhomes, condominiums, and co-ops) was $284,600 in May 2020, while that number increased to $295,300 in June.”1
I used the NAR median home price of $295,300 and assumed a down payment of 10%, or $29,530, with the amount to be financed of $265,530 for 30 years. Then I used a mortgage calculator I sourced using a Google search2 to calculate the monthly principal and interest at various rates taken from the June 6, 2021 First Horizon Baseline Forecast Scenario. Here’s what I came up with:
Many home shoppers know how much they can afford to spend per month on a house payment. Using that as the starting point, they then check on mortgage rates to see how much home they can “afford”.
What I wanted to do was to see how much home the folks could afford at the forecast rates assuming they only had the 2021 year income to spend. The following table illustrates those prices.
| Monthly Payment | 30 Year Mortgage Rate | Amount Able to be Financed | Home Price Affordability with 10% Down |
|---|---|---|---|
| $1,183 | 3.43% | $265,770 | $295,300 |
| $1,183 | 4.08% | $245,500 | $272,778 |
| $1,183 | 4.44% | $235,100 | $261,222 |
| $1,183 | 4.89% | $223,100 | $247,889 |
Let me be clear, I am not forecasting that this will or even might happen; I am only outlining a scenario where mortgage rates increase and home prices decline as a result.
Using the numbers in this scenario, someone who bought a home for $295,300 with 10% down and borrowed 30 year money to finance it at 3.43%, could potentially find themselves with an asset worth $47,411 less than they paid for it.
The following chart is the Year over Year Percentage Change in the S&P CoreLogic Case-Shiller U.S. National Home Price Not Seasonally Adjusted Index:
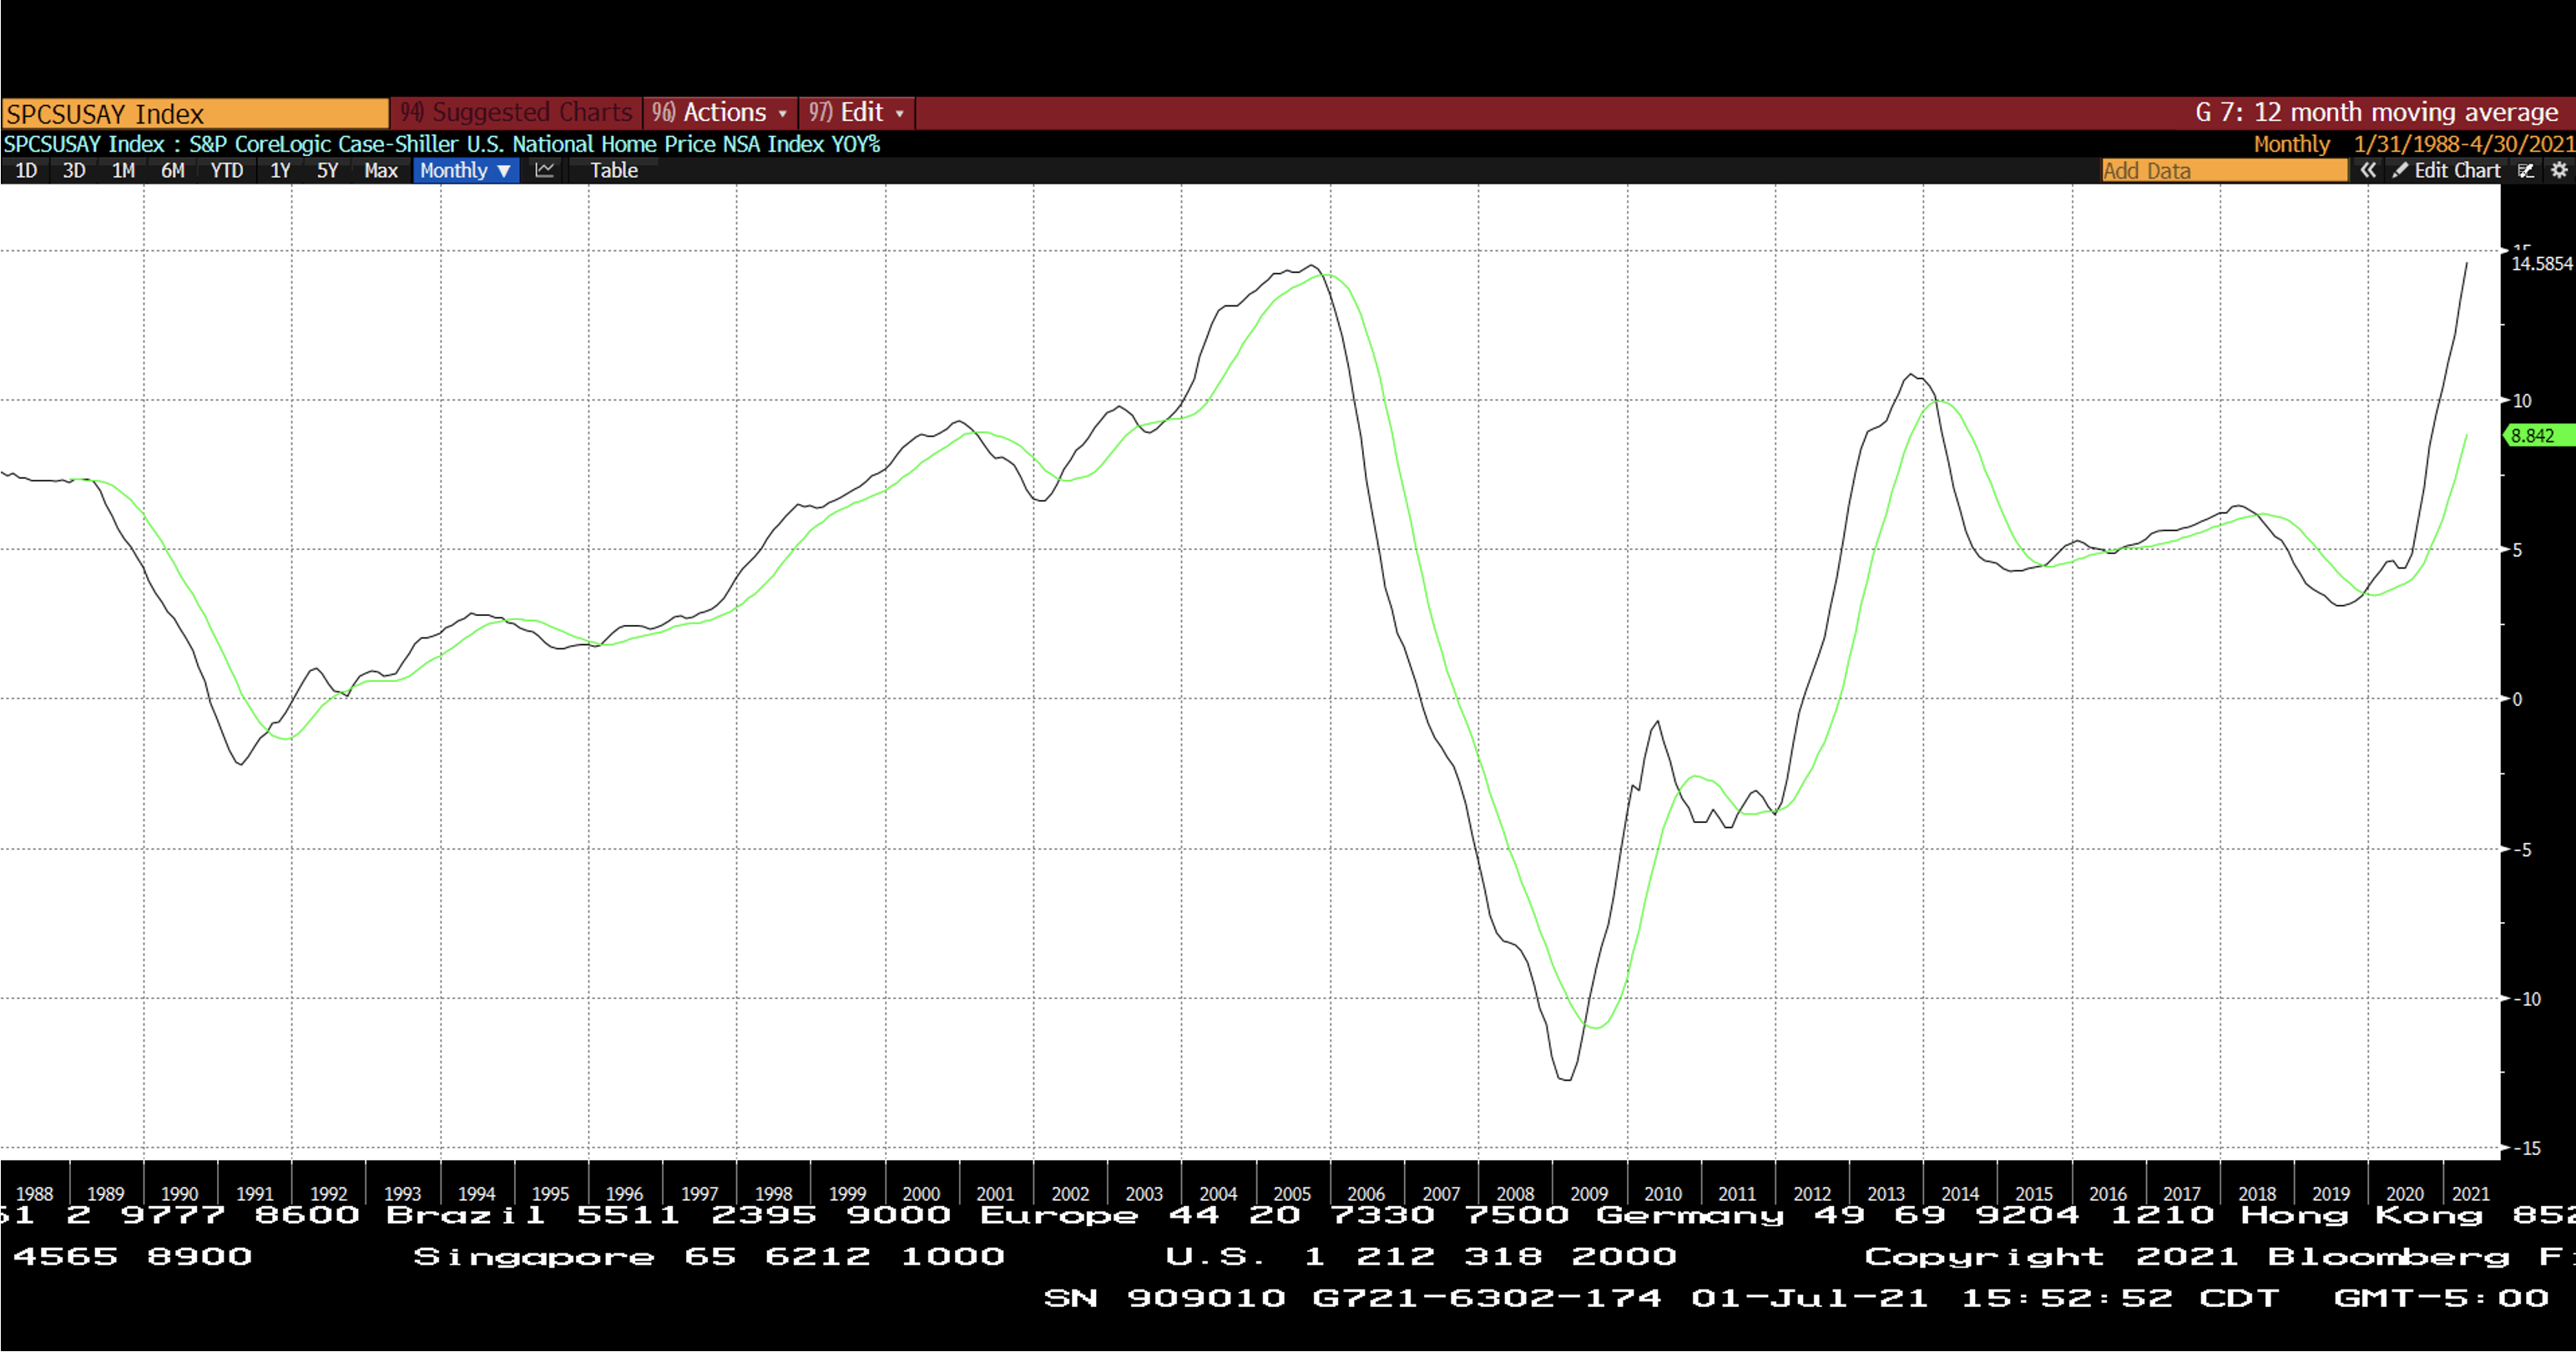
Source: Bloomberg
With the recent run up in home prices, they might be more vulnerable than usual to an uptick in mortgage interest rates. Again, this is not a forecast of impending doom, just an acknowledgement that what goes up, sometimes goes down. I would also observe that the last time we saw this sort of surge in prices it was followed by a very sharp correction – note the area of the chart following the peak in late 2005.
Why Might Interest Rates Go Up?
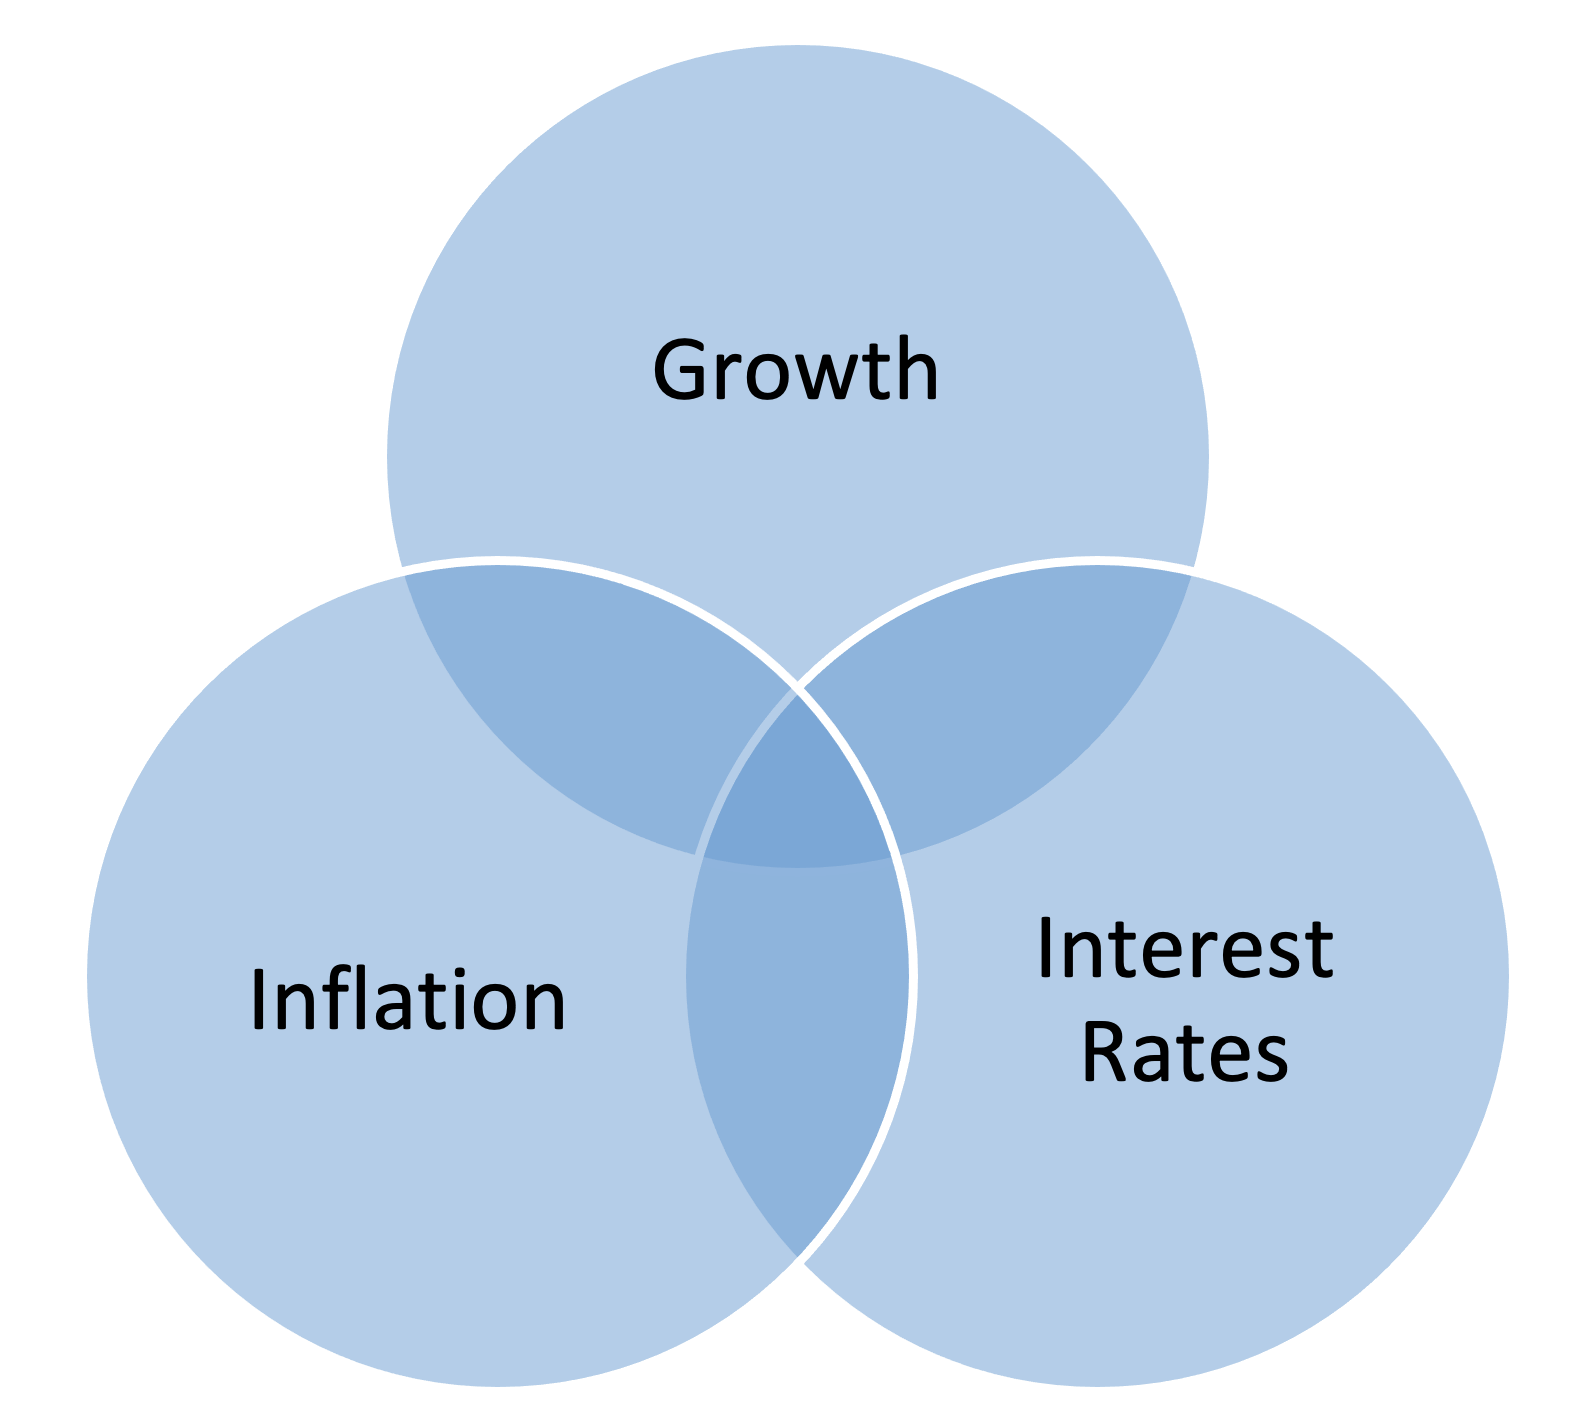
The relationship between economic growth, inflation and interest is something of a feedback loop. Stronger economic growth, all else equal, may boost inflation and interest rates. Higher rates may cool the growth that caused it. If/when growth slows, inflation may slip lower as a result.
Here is a graph that shows plausible “guess-timates” (but not forecasts!) of relevant economic variables:
What we see in this table is the interplay between growth, inflation and interest rates. Expected growth in 2021 looks unreasonably high, but that is due to the “base effect” of the pandemic induced recession. But it is still forecast to be over 5% in in 2024. With headline inflation forecast to be 2.3% at that point in time, it would surprise me if the rate on 10 Year Treasury was only 2.26%.
Inflation, as measured by the Consumer Price Index, is running hot. Many economists attribute the recent surge to an assortment of pandemic related causes ranging from the so-called base effect to supply chain bottlenecks. The word they most frequently use to describe currently reported levels is transitory. Whether or not it turns out to be transitory, only time will tell. Although I suspect that it is totally coincidental, the last time we registered increases of this level was just before the Great Financial Crisis.
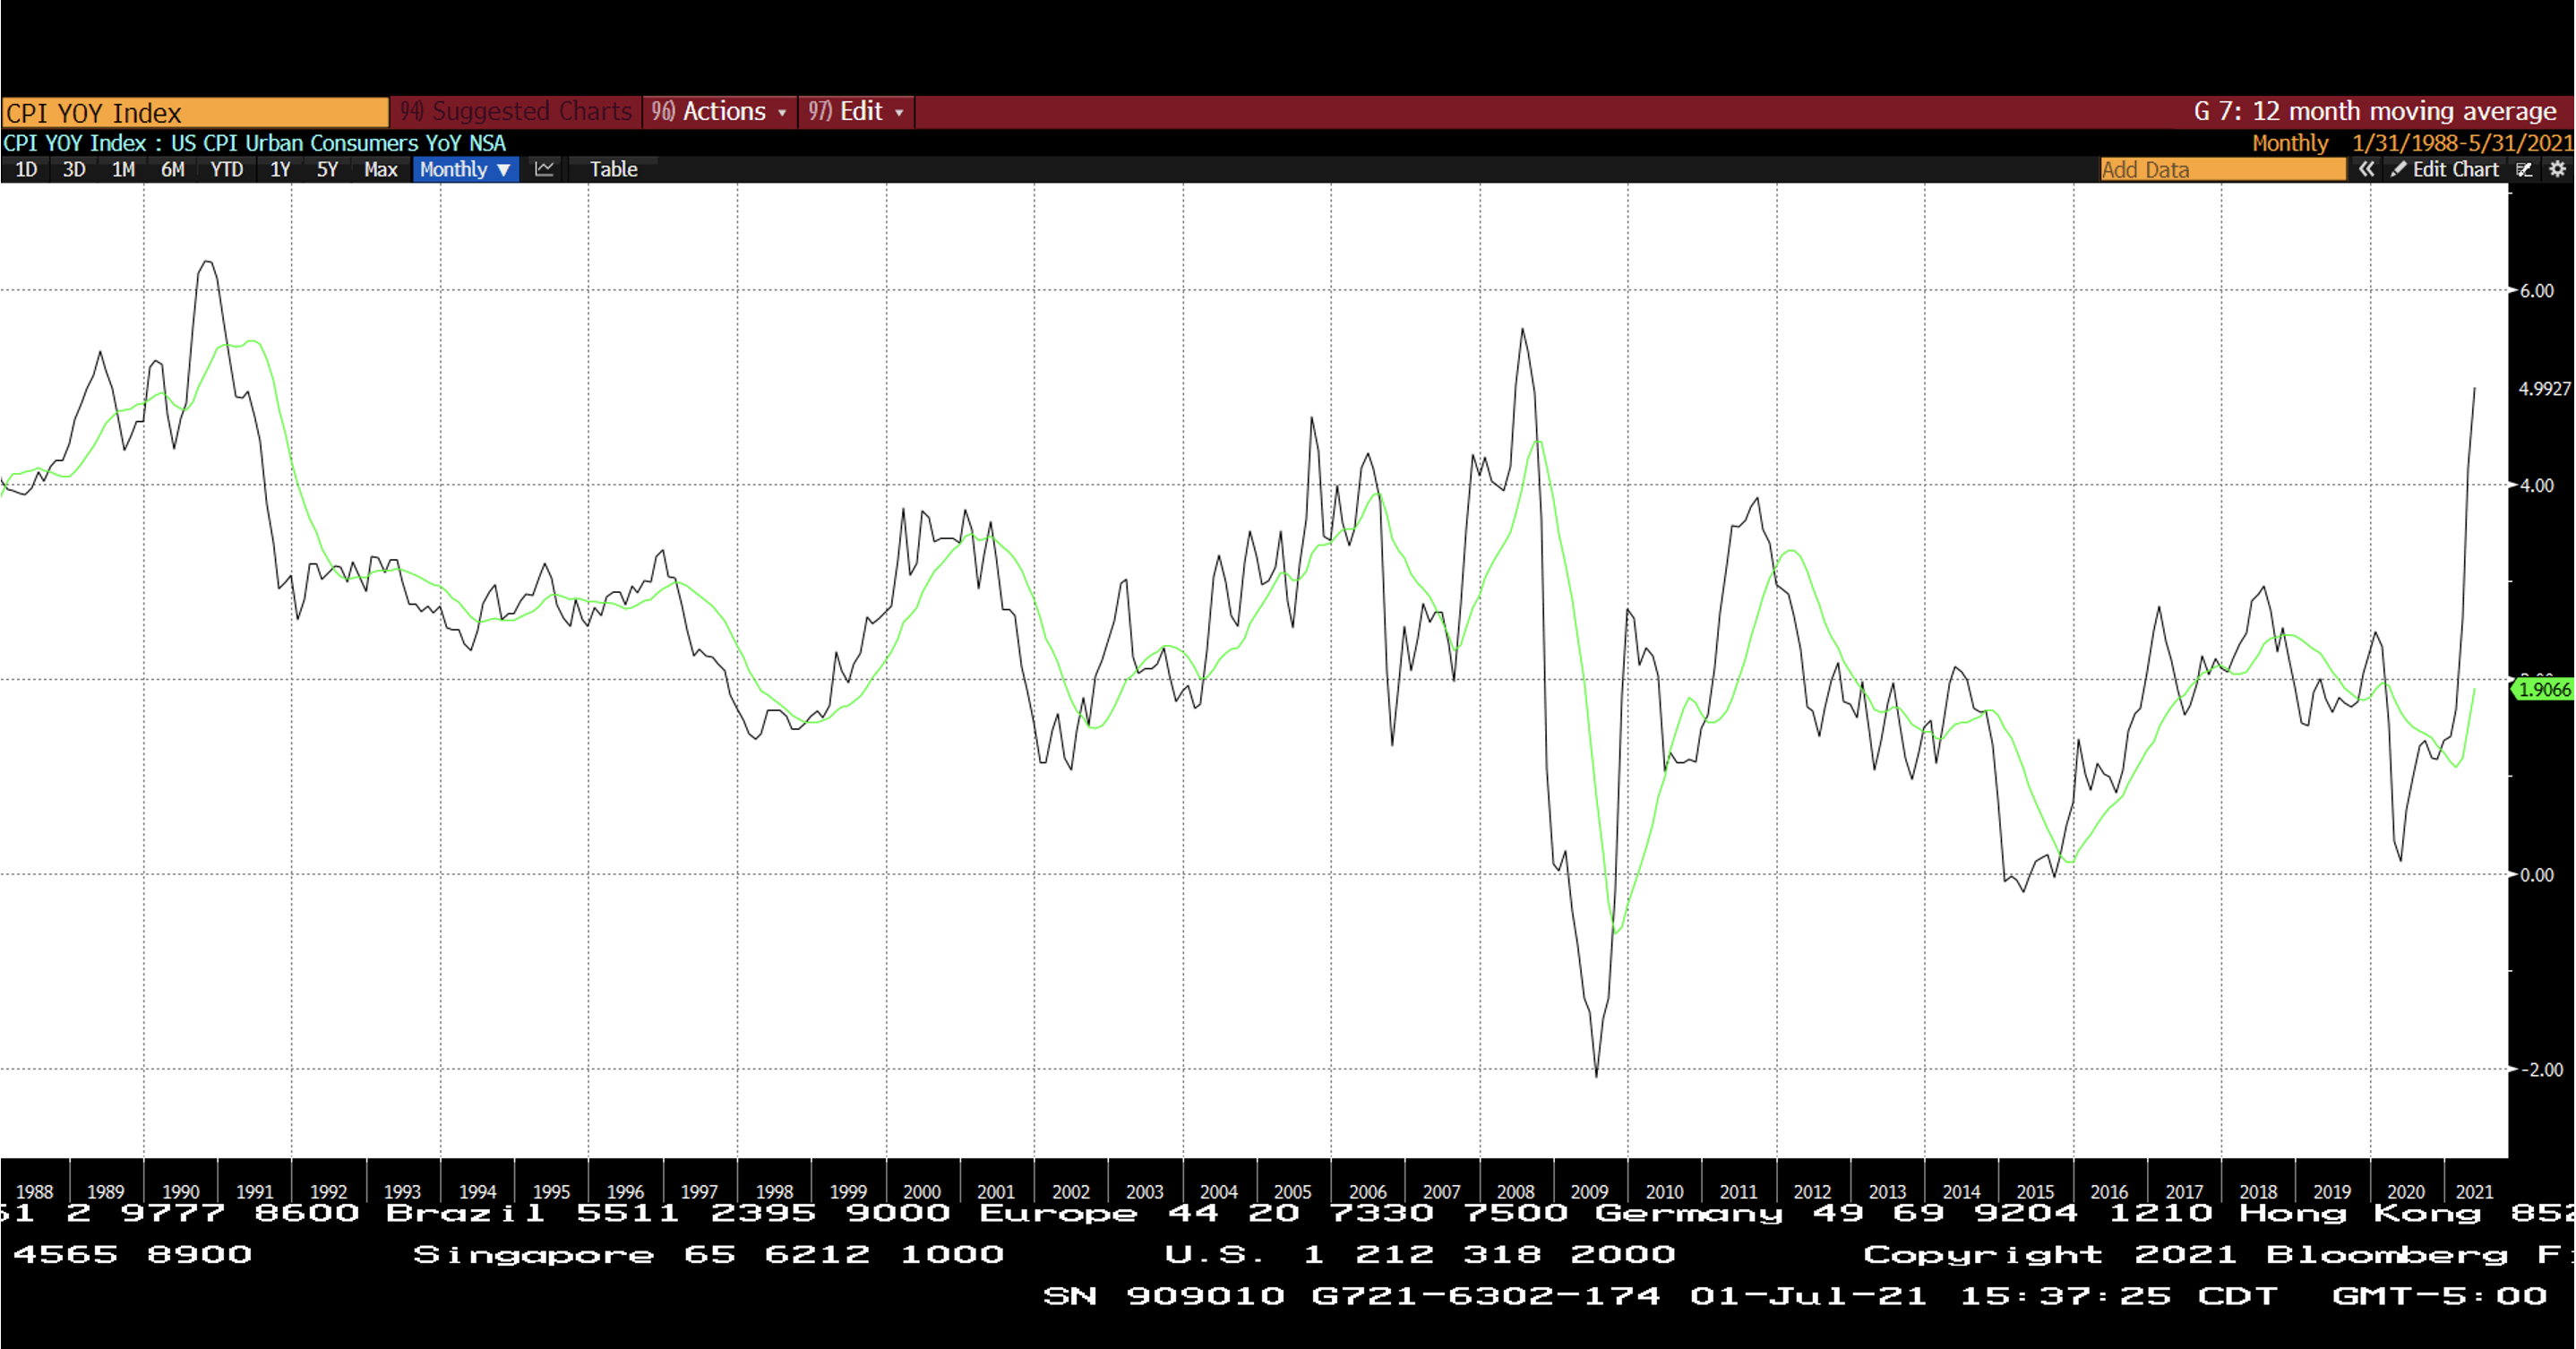
Consumer Price Index Year over Year % Change (Annualized Basis)
Source: Bloomberg
Ten year note yields have recently turned up. Could it be the beginning of a new trend?
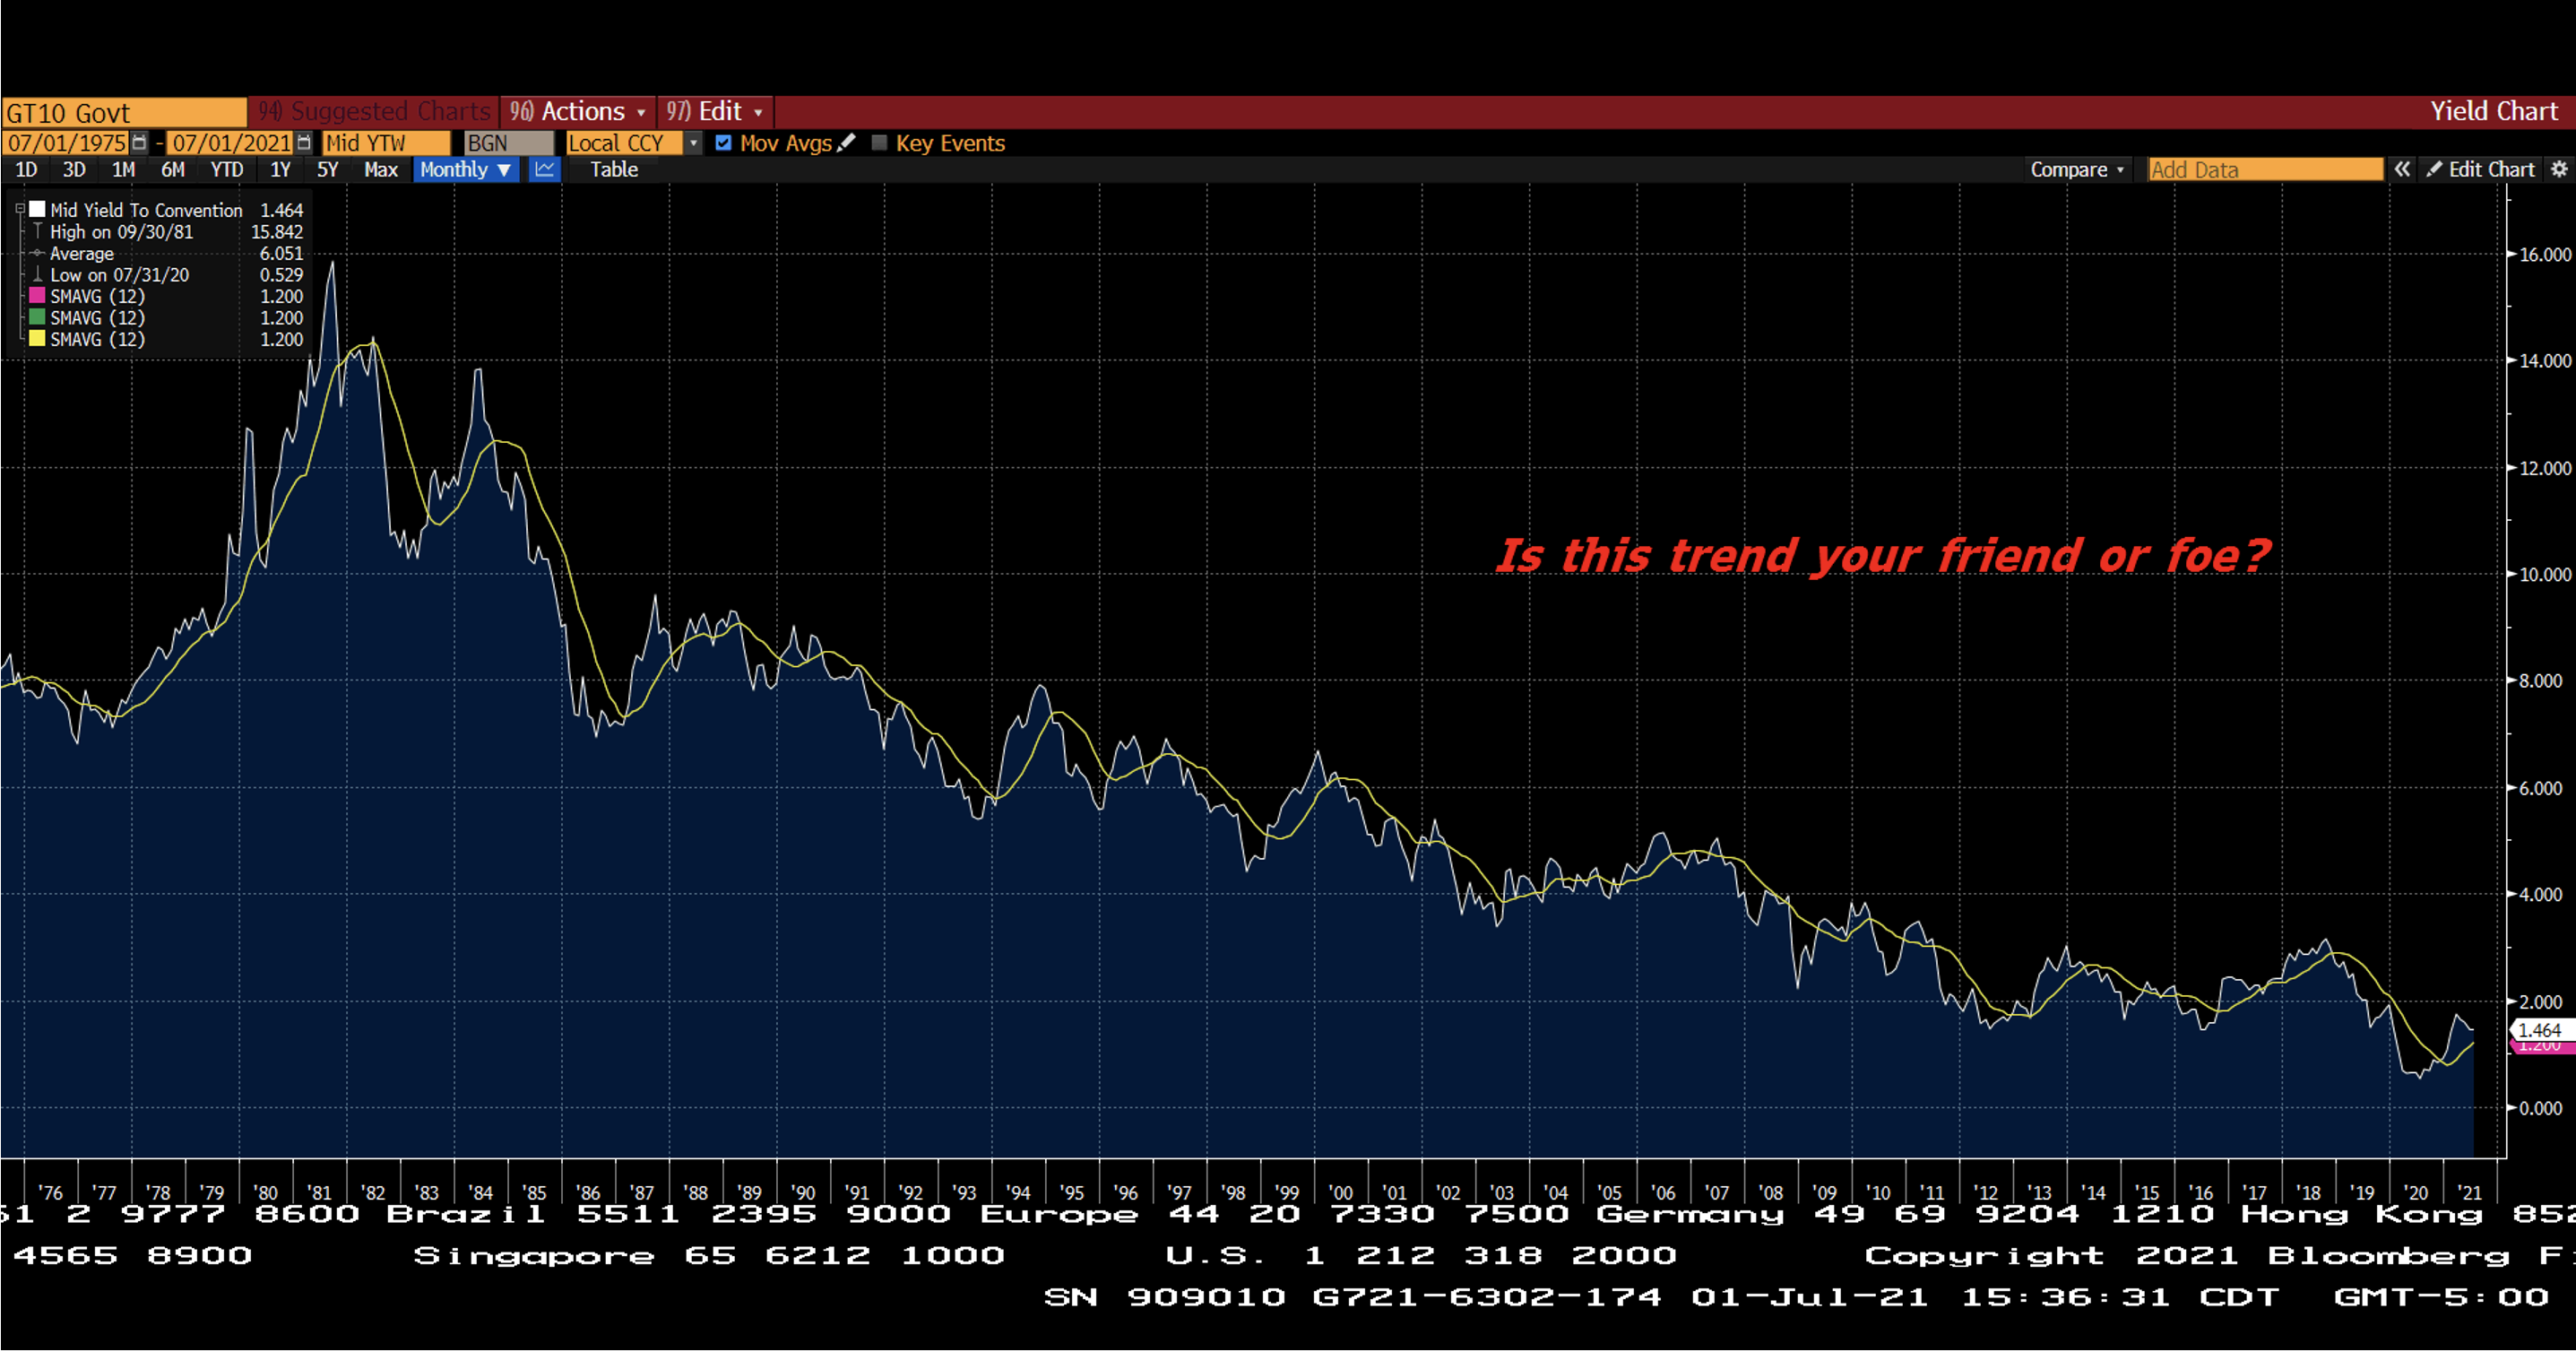
Source: Bloomberg
What I see in this collection of data and charts is a very strong economy that may be driving inflation and interest rates higher. Historically that combination has not been ideal for home prices or the stock market.
My short term concerns should not translate into a change in your long term asset allocation strategy. That strategy should be the result of a comprehensive financial plan that does not include timing the market’s ups and downs. If and when your time horizon, goals or objectives change, that’s the time to reassess your risk tolerance and portfolio construction.
Be well, stay safe!
Jerry Laurain, CFA
Chief Investment Officer, President, Advisory Services
The contents of this newsletter should be used for informational purposes and should not be considered an offer to buy or sell a security or investment in a particular portfolio or strategy. Opinions in this newsletter are subject to change without notice.