2024 is a big election year, not only in the United States, but in something like 40 other countries around the world. Of course, we are already getting plenty of questions about how the election outcome will impact the market. We are responding the way we have since we began writing this letter: it’s impossible to know.
Sure, it’s possible to look at various political regimes and record the returns generated during those periods. From a statistical point of view, however, the relatively small number of observations does not lend itself to significant results. It may appear that there are patterns, but it is impossible to say with certainty that they are valid. Let’s take a look at some data generated by the macro mavens at Piper Sandler.
S&P Performance* Under Different Partisan Control
| S&P Average Annual Return | Number of Years | |
| Total 1945-2023 | 9.1% | 79 |
| Divided government | 8.3% | 47 |
| Same party | 10.2% | 32 |
| All Democratic government | 9.3% | 24 |
| All GOP government | 12.9% | 8 |
| Democratic president | 11% | 39 |
| GOP president | 7.1% | 40 |
| All Democratic congress | 7.2% | 46 |
| All GOP congress | 13% | 18 |
They looked at 79 years of Bloomberg data from 1945 through 2023. Over that span, the average annual return of the S&P 500® was 9.1%. The various scenarios they examined can run together, for example, what if you had a divided government with a Republican president? Or a divided government with a Democratic president?
The reality is that there is a very wide range of factors that impact corporate earnings, the economy and the capital markets well beyond which party wins which elections. Don’t fall for the temptation of looking at these raw numbers and concluding that a Democrat in the White House is good and a Republican is bad, or that a divided government generates lower returns than one where the same party controls both houses. (For additional information, please see Piper’s The Presidential Cycle Theory Of Markets).
This is a good time to remember two quotes widely attributed to Mark Twain:
“Figures don’t lie, but liars figure.”
“There are lies, damned lies, and statistics.”
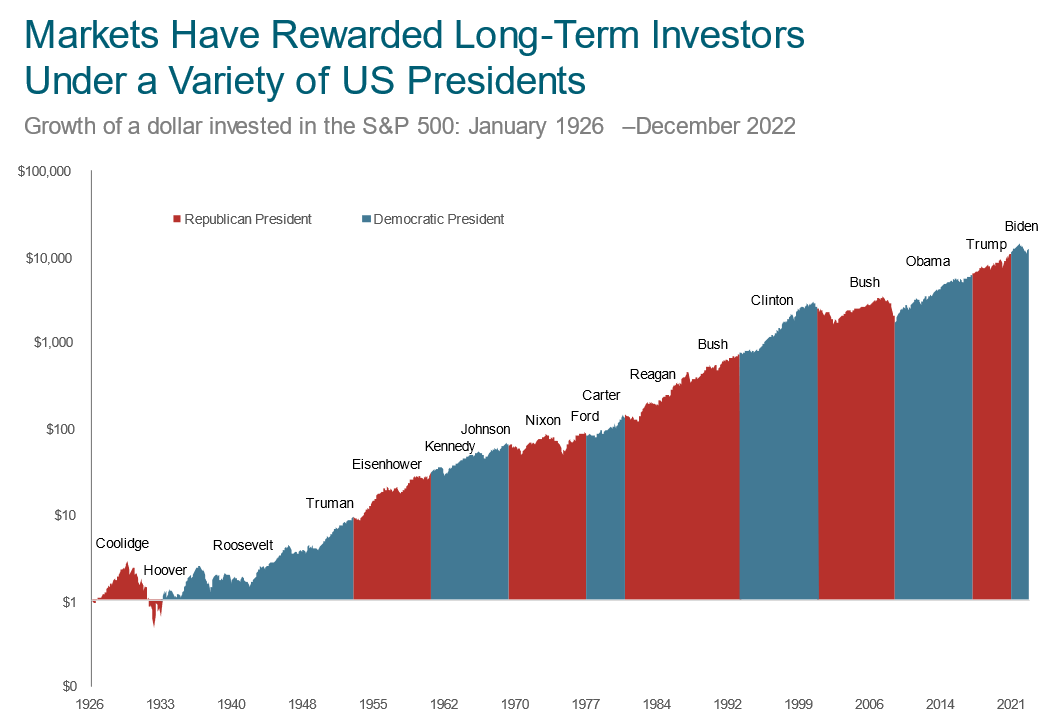
For a visual representation, we want to share some graphics from our friends at Dimensional Fund Advisors. Here is a look at S&P 500® returns in all the administrations since 1929:
Bottom line? Red or blue, the market is very capable of rewarding investors regardless of party affiliation.

At the close of the year, our Five Factor Framework’s dashboard was showing us two red lights, two yellow lights and one green light.
The red warnings are coming from the year-over-year growth rate of leading economic indicators (LEIs) and the monetary regime. The good news is that the contraction in the LEI growth rate has stalled and it looks like it can improve before it gets worse. Although we are coloring it red for now, we are leaning toward yellow. With respect to monetary policy, we have to say that rates remain higher than they have been since before the Great Financial Crisis, and the Fed continues to let their balance sheet shrink. Powell has signaled a pivot, but until we see it (lower target rates on Fed funds) happen, we will keep this on red with the understanding that the next move will be into yellow and possibly green.
The yellow lights are shining from the valuation and sentiment factors. Valuations are essentially on top of their longer-term averages. Sentiment has been bouncing around with Fed speak. If the market can make new all-time highs, this factor is likely to turn from yellow to red.
And speaking of all-time highs, the S&P 500® is well above its 12-month moving average, so market trend is giving us a green light.
As always, we offer the disclaimer that the Five Factor Framework is not a market timing tool as much as it is a starting point in discussions aimed at answering the question, “What factors might impact the stock market over the next six to 18 months?" Given that we are now in an election year, it is safe to expect much speculation and volatility as the pollsters call out the odds and bets are made.
Everyone at First Horizon Advisors, Inc., wishes you and your families a peaceful and prosperous New Year!
Jerry Laurain, CFA®
Chief Investment Officer, President, Advisory Services
Subscribe to Market News & Views
The contents of this newsletter should be used for informational purposes and should not be considered an offer to buy or sell a security or investment in a particular portfolio or strategy. Opinions in this newsletter are subject to change without notice.
Past performance is no guarantee of future returns. The performance of an index is not an exact representation of any particular investment, as you cannot invest directly in an index.
*S&P 500. The index measures the performance of the large-cap segment of the U.S. market. Considered to be a proxy of the U.S. equity market, the index is composed of 500 constituent companies.
Indexes are unmanaged. You cannot invest directly in an index.


